-
ZERO SUGAR WINE
-
ZERO SUGAR WINE
ALL WINE
-
SHOP BY WINE TYPE
-
SHOP PRE-MIXED CASES
-
SHOP BY DIETARY REQUIREMENT
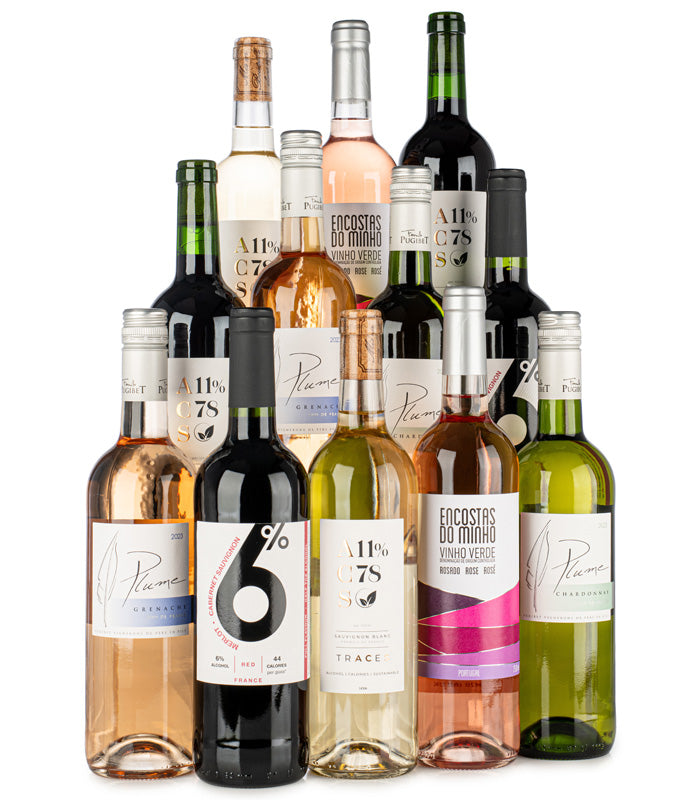
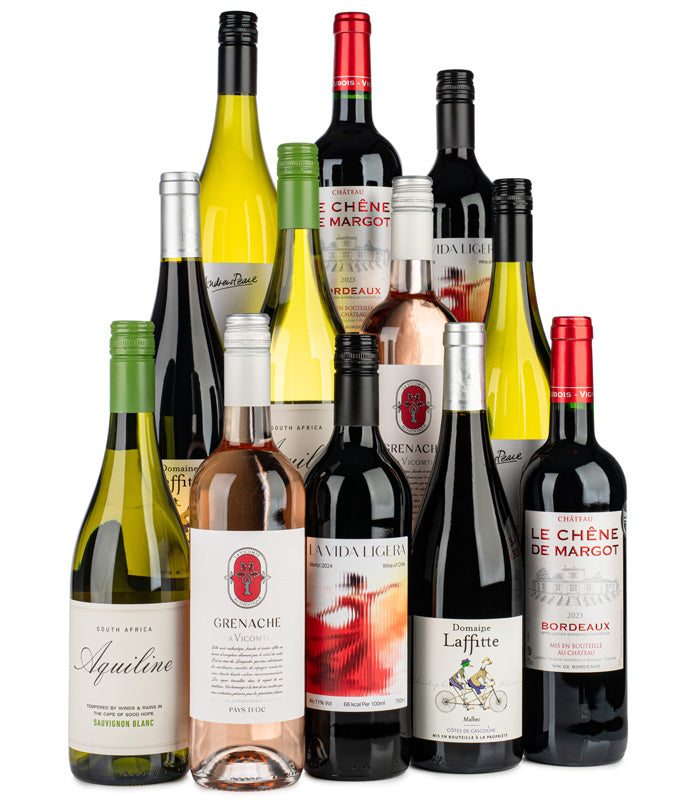
Limited Edition Winter Case
£129.99 £138.88
TRACES WINE
-
-
LOW CARB BEER
CHRISTMAS DEALS
LOYALTY


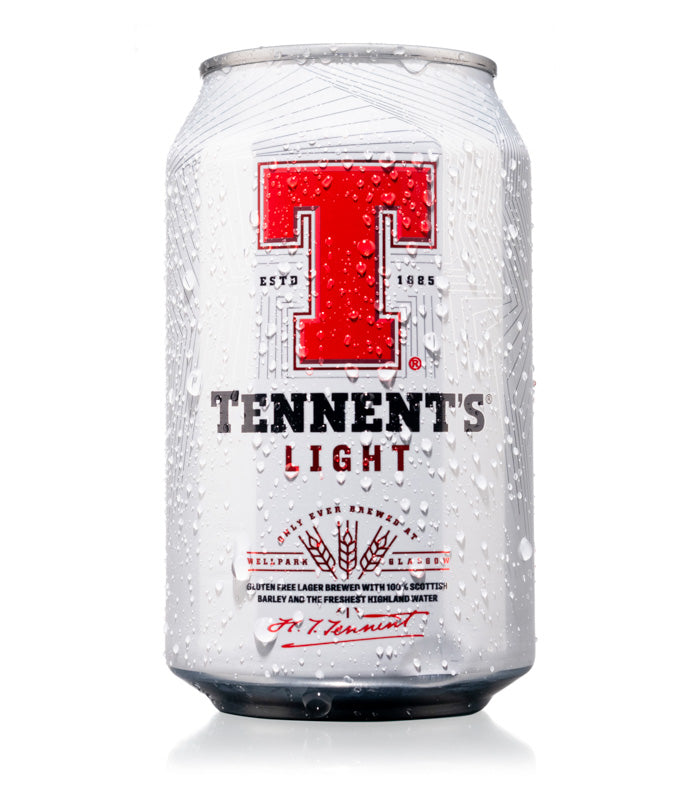
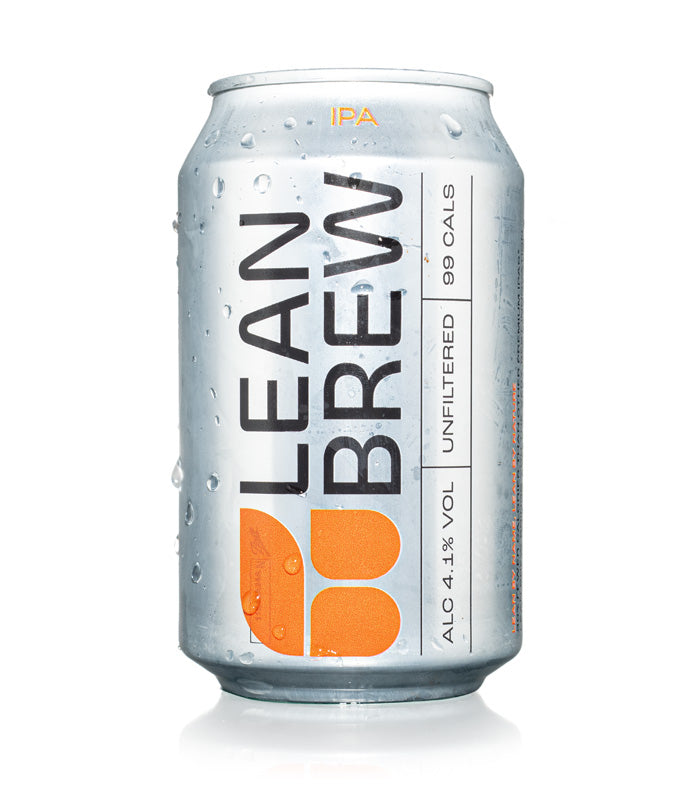

With Tokyo 2020 in full swing, we thought we’d take a look into the average alcohol consumption of some of the top medal winning countries from Rio 2016. In this article we take a look at alcohol consumption by country, and how that equates into their national drink. We’ll also be looking at which types of alcohol have the smallest ABV%, the fewest units, and what alcohol has the least calories.
What’s more, we’ll tell you how many calories you can save by switching to lower calorie or lower carb alcohol with DrinkWell.
Celebrate like an Olympic athlete with our Sparkling Wine Case:
Method
The countries chosen in this article are the top 15 medal winning countries at the 2016 Rio Olympics(1). We chose to exclude Kazakhstan due to a lack of information about their national drink, and instead chose to include the country in 16th place; New Zealand.
The data in this article is taken from statistics detailing the litres of pure alcohol consumed per capita, per year in each country(2), as well as the average calories, and serving sizes(3), of each country’s national drink(4). We used this information to work out how much each country would drink of their national drink, if that was the only alcohol they consumed. We also converted this figure to determine how many calories each country would consume of their national drink.
National Alcoholic Drinks of Each Country
Some of our top 15 medal winning countries’ national alcoholic drinks follow their national stereotypes to a T, however, there’s a few on this list that might surprise you.
Unsurprisingly, Germany and the UK both favour beer and lager, whilst Italy favours wine, and Russia prefers vodka. Australia, however, doesn’t stick to it’s stereotype of being a nation of Foster's lovers. Instead, 34% of Australians prefer bottled wine(6) over other drinks. In another twist, the Dutch seem to prefer their own version of gin, jenever, to beer and lager, whilst the national drink of France is not wine but pastis, a refreshing aperitif.
In rejecting their stereotype of being wine-drinkers, France saves 48 calories per serving, whilst Australia saves 114 calories per serving by choosing wine over the stereotypical beer. Similarly, the Netherlands saves 169 calories per serving by choosing their national drink, jenever, rather than the stereotypical beer.
Next time you’re in a foreign country, perhaps live like the locals and try their national drink, rather than shooting straight for their stereotypes. You might save a few calories along the way.
Alternatively, DrinkWell stocks a wide range of lower calorie alcohol from around the world. Discover great tasting lower calorie wines, beers, and spirits today.
Which Country Consumes the Most Calories From Their National Drink?
The UK, New Zealand, and Germany take the lead in calories consumed per capita, based on the calorie content of each country’s national drink. This isn’t too surprising, though, when you take into account that a pint of beer contains, on average, around 239 calories.
China’s low alcohol consumption is reflected in their low calorie per capita figure in comparison to some of the other countries on the list even though Baiju, is the most calorific national drink on our table, with an average of around 298 calories per 100ml serving. Everything in moderation, right?
What Alcohol has the Least Calories?
If you’re looking to reduce your calorie intake from alcohol, our data suggests that drinking clear spirits might be the way to go. South Korean soju contains only 20 calories per serving, and since it’s best drunk neat, there are no added calories from mixers.
But, if you’re looking for lower calorie alcohol closer to home, vodka (55 calories), pastis (66 calories), and jenever (70 calories) could also be a good option. Reducing your beer intake would also significantly reduce your calorie intake, but it’s clear from our data that beer and lager is a firm favourite around the world.
Alcohol Consumption Per Capita - Which Country Drinks the Most?
(L of pure alcohol per capita)
We determined how much each country drinks on average, by looking at how much pure alcohol is consumed per capita, per year, and how many units that equates to.
South Korea takes home the Gold Medal for alcohol consumption per capita, with 14.4 litres of pure alcohol consumed per capita, per year (1440 units). They are followed by Germany who consume 13.4 litres (1340 units) and France who consume 12.6 litres of pure alcohol (1260 units) per year.
This data is somewhat surprising when the ABV of each country’s national drink is taken into account. China’s national drink, Baiju, contains the most pure alcohol (52%) of our top 15 medal winning countries, but China ranks second to last in alcohol consumption per capita. Yet, despite drinking the most alcohol per capita, South Korea slips from 1st place into 8th place when ranked by ABV% of their national drink, Soju (20%).
Alcohol Consumption per Capita - Who Drinks the Least?
(L of pure alcohol per capita)
In a stark comparison to South Korea, Azerbaijan consumes an average of only 0.8 litres of pure alcohol per year. However, we must take into account that Azerbaijan is a majority Islamic country where many choose to refrain from drinking alcohol. Although, with this in mind, this figure per capita could actually be higher when you take those who do not drink alcohol out of the equation. Azerbaijan is followed by China, who consume an average of 7.2 litres of pure alcohol per year. However, whilst they may consume less alcohol than other countries, China tops the table for the highest ABV percentage of their national drink, Baiju. On average, Baiju contains 52% alcohol - 7% more than any other country’s national drink.
China is followed closely by Italy, who consume 7.5 litres of pure alcohol per capita. This may be somewhat surprising when you consider Italy’s stereotype of being wine lovers. However, recent data(5) suggests that overall consumption of wine in Italy has decreased by 34.4% in recent years - much more than any other European country (13.2%). The data also implies that there has been a shift in preference from wine to beer in recent years, with less ABV% to contribute to their overall litres of pure alcohol per capita.
Which Country Drinks the Most of Their National Drink
(L of pure alcohol per capita converted to national drinks)
These figures are calculated by converting the alcohol per capita into each country's national drink, assuming that the only alcoholic beverage that individuals in each country drink is their national drink.
We converted the litres of pure alcohol that each country drinks into what that would equate to as their national drink. This provided us with a considerably different picture of the quantity of alcoholic drinks consumed by each country, in comparison to the alcohol consumption per capita figures, which is a result of the consideration of the ABV% of each country’s national drink.
Germany claims Gold, consuming 291 litres of lager per capita, followed by the UK with 253 litres of beer, and New Zealand with 237 litres of beer. These figures may seem to be way ahead of other countries’ national drinks, but beer contains considerably less alcohol per serving than other national drinks, therefore more must be consumed to reach the original alcohol consumption per capita figure.
Lower Calorie Alcohol at DrinkWell
Believe it or not, you don’t have to sacrifice your favourite drinks to reduce your calorie intake. At DrinkWell, We stock a wide range of lower calorie beers and lagers, reduced calorie wines, reduced sugar wines, skinny spirits, and even lower calorie cider.
With DrinkWell you could save a great deal of calories, without sacrificing on quality or flavour, on some of the world’s favourite drinks. On average, a pint of beer contains around 239 calories.
At DrinkWell, our lower calorie beers contain an average of around 90 calories per serving. If you were to switch from your regular pint of beer to a reduced calorie beer from DrinkWell, you could save 149 calories per serving. But, if wine is more your thing, you could save 31 calories per glass with DrinkWell’s range of lower calorie red, white, and rose wines.
Even our bourbon could save you a few calories if you made the switch. Regular bourbon will cost you around 97 calories per serving, whilst DrinkWell’s lower calorie bourbon contains only 70 calories per serving, saving you 27 calories.
Check out our full range of lower calorie and lower carb alcohol today.
Sources:
(1) Rio 2016 Medals Table
(2) Litres of Pure Alcohol per Capita
(3) Data & Charts
(4) National Drinks
(5) Italy Recent Data
(6) Australian Drinks Data
Celebrate Like An Athlete...